E-commerce conversion rate? No! Use these 3 metrics instead

Analyzing and conversion rate is a fundamental duty for anyone managing or owning an online business. I will walk you through my top 3 and favorite metrics I use to understand and optimize conversion rate.
If you prefer to listen, have an extra comment, in 8 minutes watch my video here: https://youtu.be/HO1KZJo-HpE
Starting in the upper funnel - we have my first favorite metric:
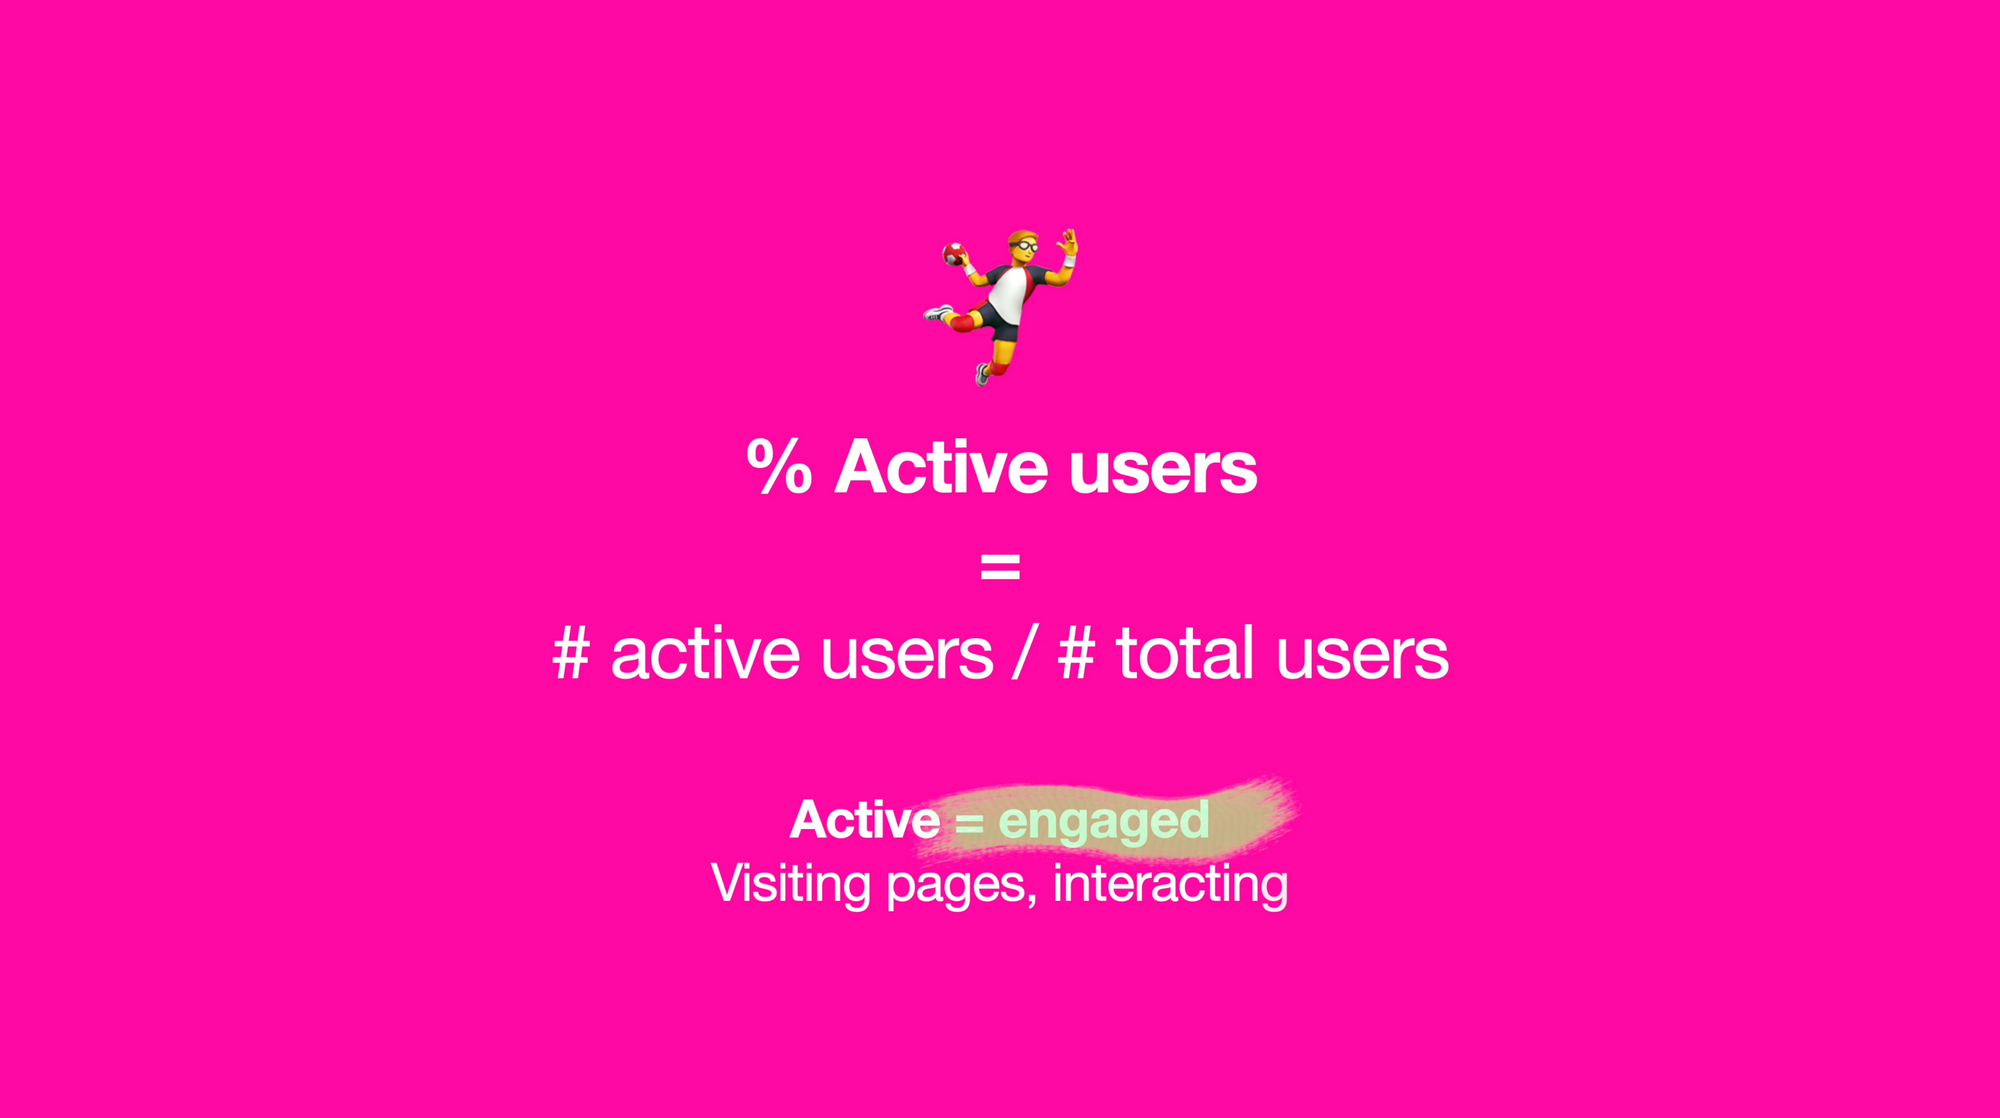
% Active users
or engaged users - the upper funnel
Active users represent the engaged users on your websites. This KPI is fundamental to understanding if there are issues in the early stage of the journey on your shop.

What is it?
Number of engaged users vs. total users that just visited
- The users that do not leave and get engaged
- Use the GA4 Active User metric
- or make your own by counting users that to some relevant actions like visiting three pages and using a filter or using the product configurator to try to select a size or color
I love this metric because it can tell us the following:
- If the website has issues in opening pages in general
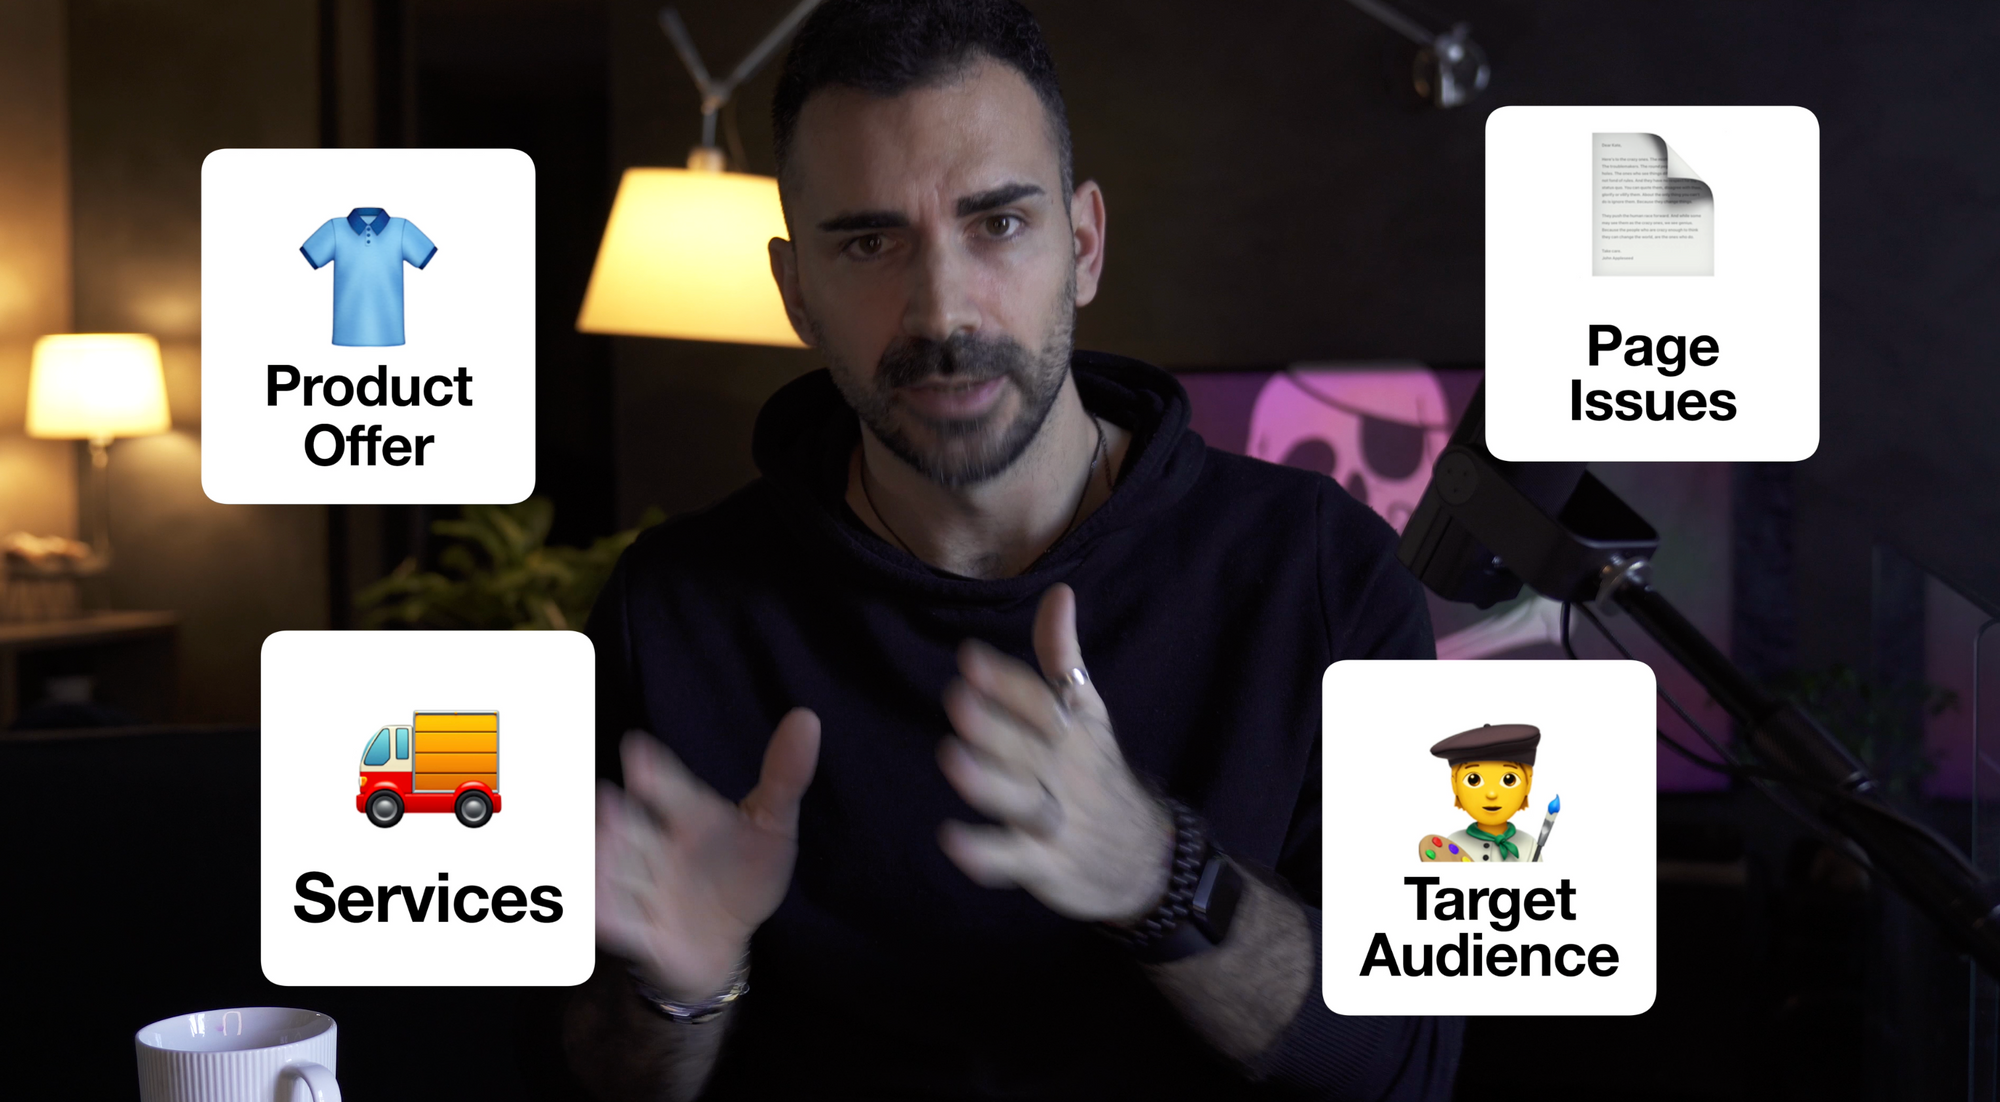
- If the marketing strategy matches the product offers, prices, and services ( shipping time and cost, returns, payment options )
- if marketing is attracting the right audience with the right interests
- if the website design and user experience are effective in leading users to take action

By tracking this metric, you can identify issues early in the buyer journey and make necessary adjustments to improve conversion rates. Additionally, a decline in active users may indicate more significant issues with your website or marketing strategy that needs to be addressed.
From my experience, the short list of nasty issues touching this KPI
- broken links - classic page not found issues
- unstable speed or page loading issues
Tips
- Test speed - I have a video and a framework for that
- Make sure you track broken links, especially if you have a seasonal product collection and you often deactivate products
- Use country or category drill-down to spot localized issues
- Use Heatmaps and tools like Hotjar to study the customer journey
Mantra
If the user is not hot, will never buy - NO engagement, no conversion
🤣 and this goes much beyond e-commerce, right?
% Add to cart - shopping
If active users are the king of the early journey, add to cart is the queen of the shopping experience.
What is it?
% of users that add at least an item to the cart
What can this KPI tell us?
- Is your user finding an exciting product? From categories and using features like filters and search?
- Are your product pages and pricing effective?
- Is there enough stock behind the products?
- Are product descriptions and pricing engaging?

Nasty issues here:
- Missing stock behind essential products
- Intermittent issues with add to cart
Tips
- If the KPI is low compared to your benchmark, check if a user is reaching product pages or if you lost it before
- Use product; category drill down to understand what's working and why
- Make sure to check every week's stock
- Having a price comparing tool with competition if you think price/discounts could be an issue
Mantra
Is conversion rate low? Check this metric - it’s totally underestimated
% Checkout completion
This metric is not a secret - that's THE checkout metric.
What is it?
- % of users that purchase starting a checkout process
- Make sure you distinguish a cold checkout start from a hot one - a very intentional one: meaning that you should look to this KPI from the step of entering at least the address to purchase -
What does it tell us?
- Are our services competitive? ( free shipping, free returns, shipping price, payment methods )
- Is our checkout easy and fast to use?
- Is our checkout technically always reliable? ( all methods that we have, in all the countries that we support, with all kinds of products )
Nasty issues
- Intermitted technical issues
- Technical issues related to certain countries, specific payment methods, certain credit cards
Tips
- Ensure you have a detailed test book for testing all use cases of checkout.
- If you sell in different countries - different taxes - and many payment methods, ensure you understand what can change and break.
- If you have doubt - simplify - remove all the barriers you can - remove some alternative methods - and add them again to testing.
Mantra
We spent a lot, and it was hard to convince them to buy - now that they want - make sure it works
🤣 I'll not make the joke - but like in general - after all the effort - make sure you deliver
Process tips - time & market
These were my 3 top metrics and detective kit for understanding issues or new potential on a project.
Market benchmark
- Make sure you have a specific reference for each KPI based on your industry on how much is good or bad - and this range of reference.
Comparing data
- Learn to compare data in time to recent periods like this week versus last week.
- Learn to compare data to this week versus this same week of last year - essential reference because it considers seasonality and promotion, e.g., black Friday week, compared with a Black Friday week of last year.
- Use segmentation to understand localized issues for each of the top 3 metrics: % Active users, % Add to cart, % Checkout Completion.
Conclusion and useful resources
I have a free member area on my website where you can find my notion list on Market benchmarks for each KPI
Make sure you subscribe to my Youtube Channel if you like this kind of content; I am making a series of shorts called "Inspiring E-Commerce" that will contain:
- Crazy negative cases that we solved
- Genius simple solutions that unlocked crazy growth